Note: The images shown are static screenshots of fully interactive Power BI dashboards. If you’d like a live walkthrough or demo of the dashboards in action—complete with filters, drilldowns, and real-time interactivity—I’d be happy to share. Just reach out via Contact Me!
Clarksville Junkyard Sales Dashboard
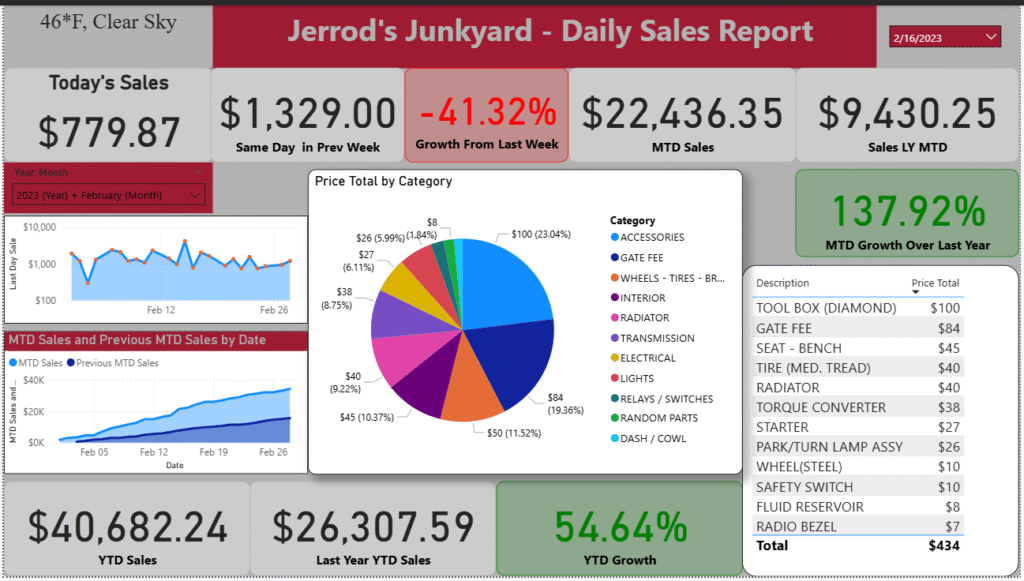
This interactive sales dashboard was designed and created for a local junkyard to monitor and analyze performance at multiple levels. It provides:
- Daily Sales Tracking with same-day comparisons to the previous week’s performance
- Month-to-Date (MTD) sales vs. the same period last year
- Year-over-Year (YoY) trends to highlight growth and seasonal patterns
The dashboard was built in Power BI and follows a clean, visual layout modeled after professional reporting standards. I used Excel workbooks from proprietary software to prep and organize the data, then structured the visuals to support decision-making for small business operations.