
View Full Interactive Dashboard

This project was built from the ground up using SQL and PowerBI. A fully structured relational database was created to simulate a real-world e-commerce system, including custom tables for customers, orders, order items, products, payments, and teams. Using SQL scripts, the database was populated with sample sales data to mimic seasonal trends, customer behavior, and product performance. This clean and scalable data model serves as the engine powering the Power BI dashboard, enabling precise queries and meaningful business insights.
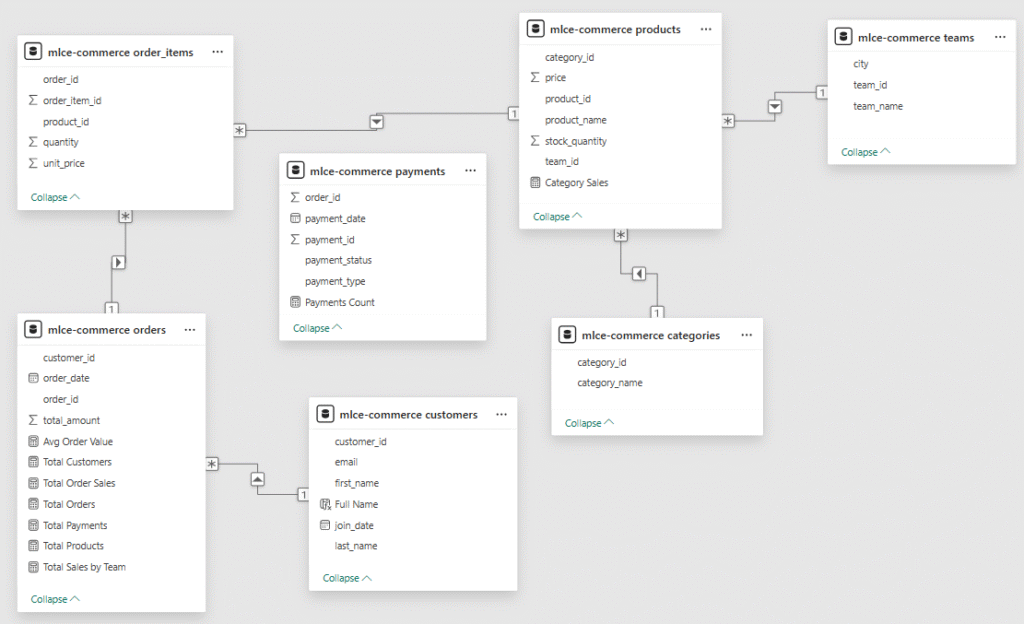
This Entity Relationship Diagram (ERD) outlines the foundational data architecture of the MLC E-Commerce system. It illustrates how core tables—such as customers, orders, products, and payments—are connected through primary and foreign keys. A normalized structure ensures data consistency and performance, enabling complex SQL queries and efficient analysis. This schema forms the backbone of the insights delivered in the Power BI dashboard.
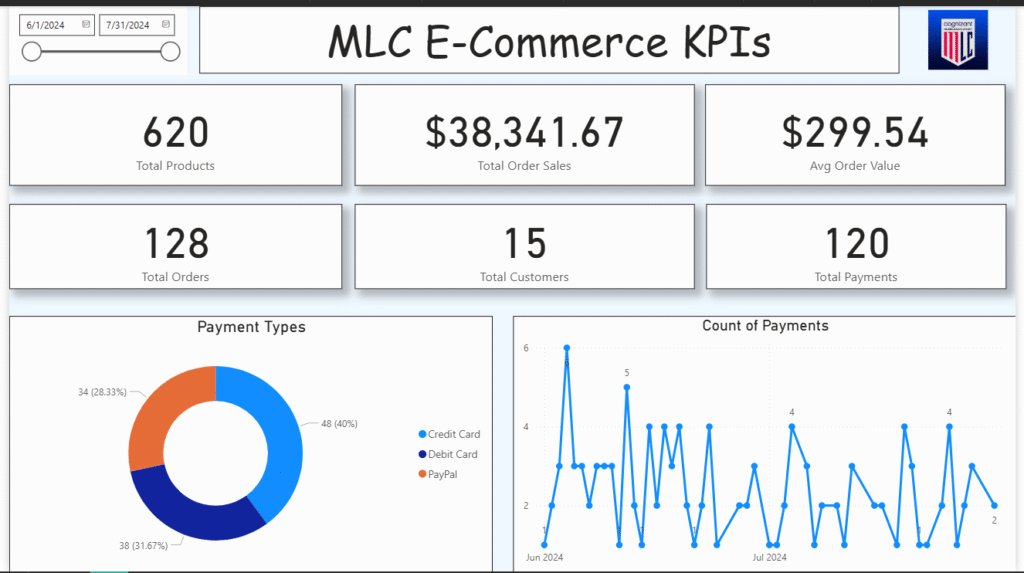
The KPI section highlights critical business indicators including total orders, average spend per customer, and PayPal usage patterns. These high-level metrics help stakeholders track success, spot anomalies, and prioritize next steps. Built with clarity and interactivity in mind, each KPI updates instantly based on filters applied across the dashboard—supporting confident, data-driven decisions at every level.