Note: The images shown are static screenshots of fully interactive Power BI dashboards. If you’d like a live walkthrough or demo of the dashboards in action—complete with filters, drilldowns, and real-time interactivity—I’d be happy to share. Just reach out via Contact Me!
MPG Transport – Daily Operations Dashboard
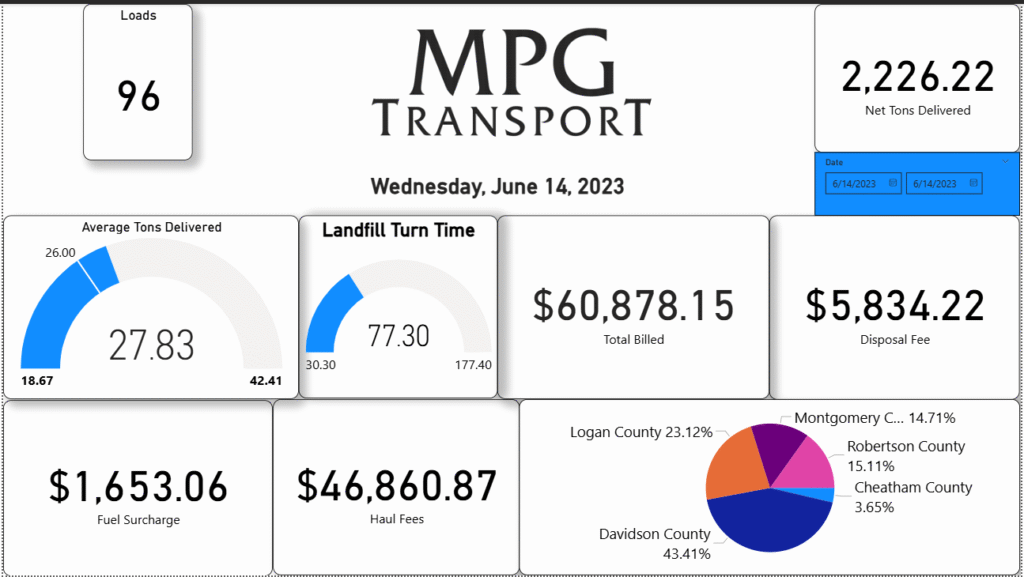
This Power BI dashboard was developed for a regional long-haul waste transport company seeking a clearer picture of its daily operations. I was given minimal instructions and full access to raw GPS, dispatch, and billing data through Microsoft 365 and tracking software. The business needed key metrics surfaced in a clean, executive-ready format.
Highlights:
- Displays daily KPIs including: total loads, net tons delivered, average tons per load, and landfill turn time (based on GPS timestamps).
- Tracks daily revenue components, including: haul fees (calculated using tons × $13.10), fuel surcharges, and disposal fees.
- Compares individual county contributions via an interactive pie chart.
- Built entirely from raw exports without a pre-cleaned dataset, requiring data shaping, relationship modeling, and DAX measures.
- Emphasizes visual clarity and quick scanability for operations managers and owners.
This was my first industry-facing dashboard and proof that with the right data and objectives, I could design a solution independently that delivers real business value.
Maintenance & Work Order Dashboard – MPG Transport
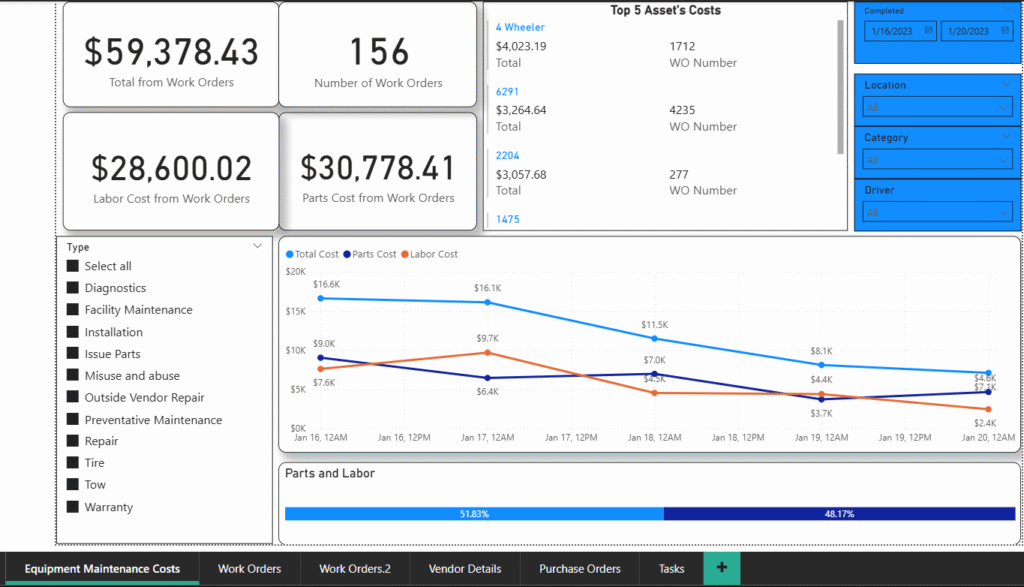
This interactive dashboard was developed for MPG Transport’s maintenance department to track and analyze work order activity and associated costs. Built in Power BI, it provides decision-makers with a clear, real-time breakdown of labor costs, parts costs, and total expenses over a selected date range.
Key features include:
- Dynamic KPIs showing:
- Total Work Order Costs
- Number of Work Orders Processed
- Labor Costs vs. Parts Costs
- Cost Trend Analysis across time, comparing labor, parts, and total spend to help spot spikes, inefficiencies, or cost reductions.
- Asset-Level Cost Tracking with a ranked list of the top 5 assets by work order expense, helping leadership prioritize equipment for repair or replacement.
- Custom Filters by:
- Type of maintenance (e.g., Preventative, Diagnostics, Warranty, Outside Vendor Repair)
- Completion Date
- Location, Category, and Driver
- Cost Breakdown by Category using visual elements like stacked bar charts and slicers to simplify comparison between labor and parts.
This dashboard was built from raw maintenance and vendor datasets exported from MPG’s fleet maintenance system. downtime.
Work Order Details Tab – MPG Transport Maintenance Dashboard
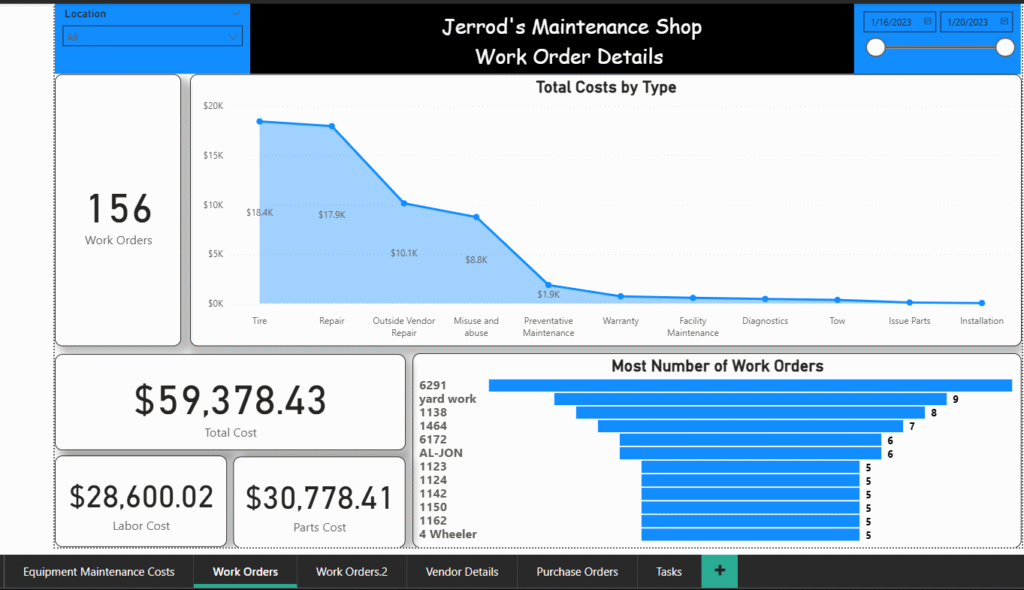
This secondary tab in the MPG Maintenance dashboard provides a detailed breakdown of work order volume and cost distribution across maintenance categories and assets. Designed in Power BI, it gives operational leaders visibility into which types of work are driving costs and which assets are most frequently in need of service.
Key Features:
- Total Work Orders Summary
Displays the total number of work orders submitted within the selected date range (e.g., 156), alongside a breakdown of labor and parts costs, and an overall total cost. - Cost by Type Visual
A combined area + line chart compares work order categories by total cost:- Categories like Tire, Repair, and Outside Vendor Repair stand out as the top expenses.
- Lower-cost types such as Preventative Maintenance, Diagnostics, and Warranty are also shown for holistic insights.
- Most Active Assets Chart
A horizontal bar chart ranks assets by the number of work orders, helping maintenance teams identify which vehicles or equipment demand the most attention. - Interactive Filtering
Includes slicers for location and date range, allowing users to focus the analysis on specific regions, shops, or timeframes for tighter cost control and planning.
Project Scope:
This tab enhances the maintenance team’s ability to:
Control vendor-related costs with visual clarity.
Prioritize high-cost or high-frequency assets for inspection or replacement.
Evaluate the ROI of preventative maintenance versus reactive repair.