View Full Interactive Dashboard
This interactive Sales Analytics Dashboard simulates a Salesforce CRM environment using SQL and Power BI to track key performance metrics across the sales pipeline. Built entirely from scratch using custom sample data, this dashboard offers comprehensive insights into lead generation, opportunity management, sales conversions, and team performance.
✅ Key Features:
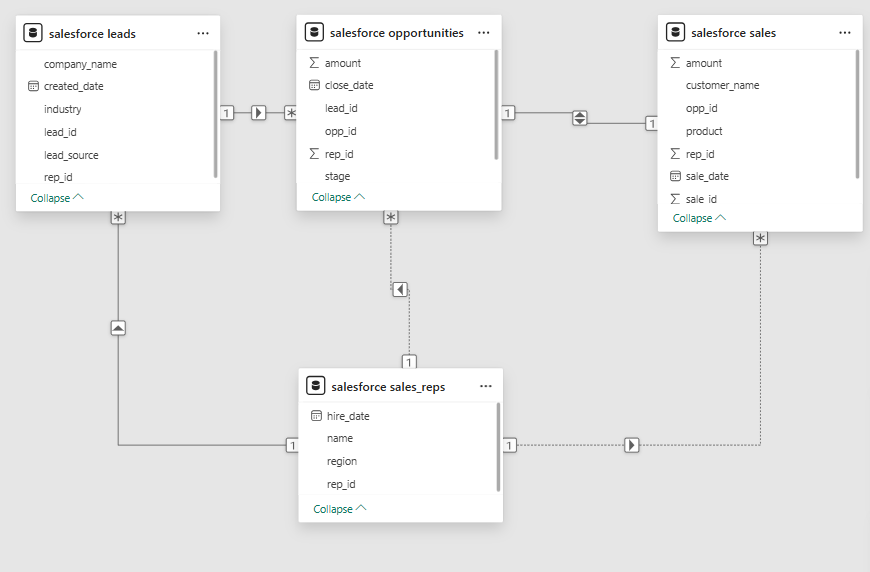
- Fully Modeled Data Schema:
- Designed a relational database with four core tables:
sales_reps,leads,opportunities, andsales. - Populated with realistic mock data representing a small U.S.-based business from Jan to Aug 2025.
- Designed a relational database with four core tables:
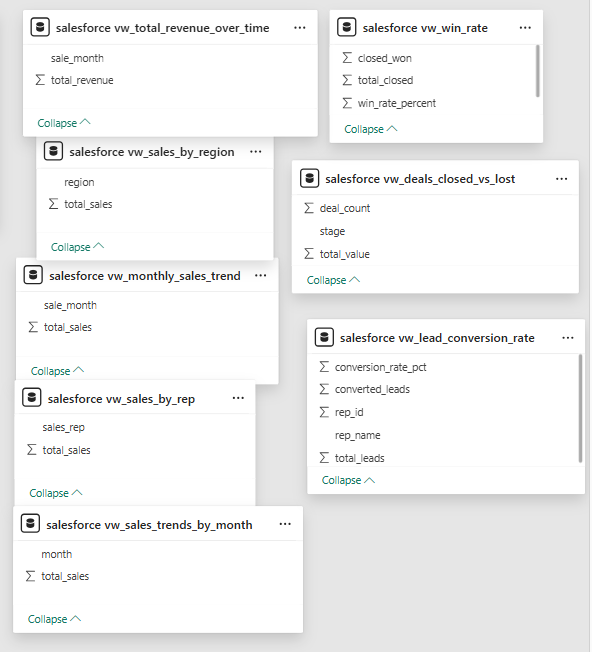
- SQL Views for Power BI Integration:
- Created individual SQL views for each visual to streamline Power BI imports.
- Leveraged Power BI’s DirectQuery capability to reflect updates dynamically.
- Dashboard Components:
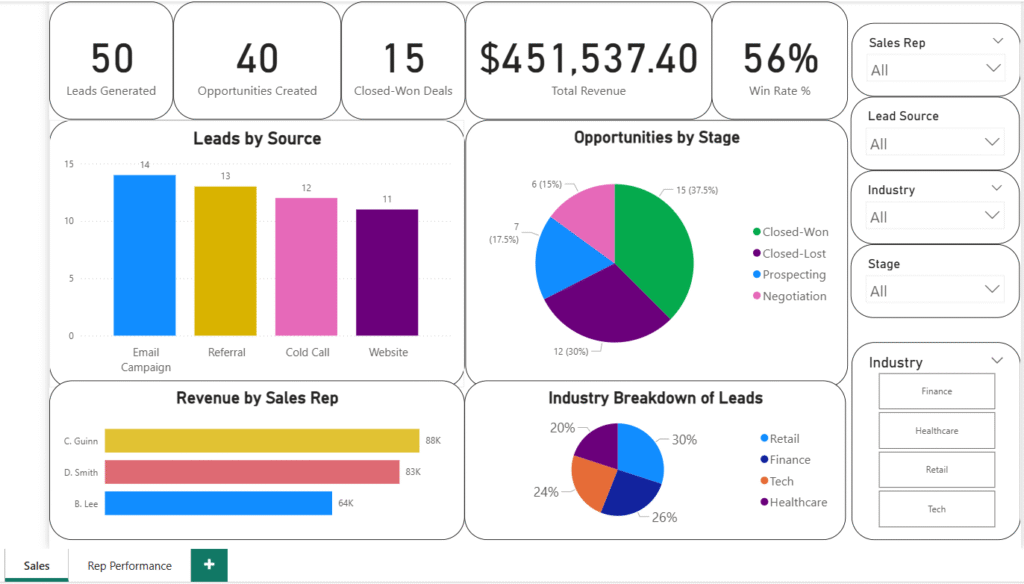
- Top KPIs:
- Leads Generated, Opportunities Created, Closed-Won Deals, Total Revenue, and Win Rate %.
- All values are dynamic and respond to slicer filters.
- Bar Charts:
- Leads by Source: Shows which marketing channels are most effective (e.g., Email Campaigns, Referrals).
- Revenue by Sales Rep: Highlights individual sales performance.
- Pie Charts:
- Opportunities by Stage: Visual breakdown of deal progress (e.g., Closed-Won, Negotiation).
- Industry Breakdown of Leads: Indicates the market segments most commonly targeted.
- Filters/Slicers:
- Interactive dropdowns for Sales Rep, Industry, Lead Source, and Opportunity Stage.
- Top KPIs:
- Calculated Metrics:
- Created a dynamic Win Rate % using a DAX measure that responds accurately to all filters.
- Cleaned and updated data in MySQL to replace placeholder IDs with realistic names for clarity and professionalism.
🛠️ Skills Demonstrated:
- Data Modeling & Relational Schema Design
- SQL View Creation for BI tools
- Power BI Visual Development
- DAX Measure Writing
- Data Cleaning & Optimization
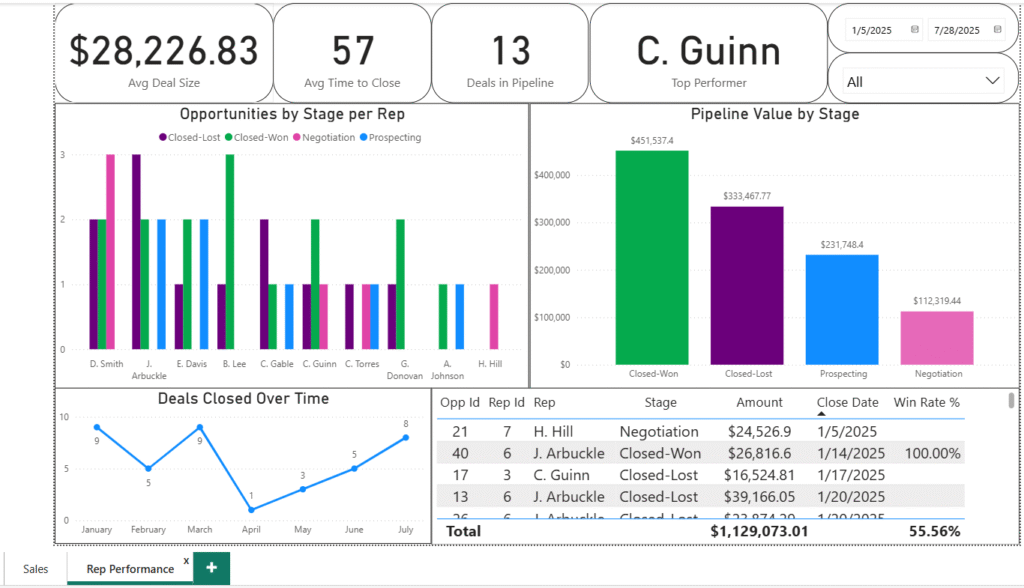
Rep Performance & Pipeline Analysis
This dashboard page delivers a deeper look into sales rep activity and pipeline health. I designed this view to support sales leadership in monitoring individual performance, identifying bottlenecks, and spotting revenue opportunities at each sales stage.
Key features include:
- Opportunities by Stage per Rep – A bar chart showing how each sales rep is progressing deals across stages such as Prospecting, Negotiation, and Closed-Won.
- Pipeline Value by Stage – Visualizes the total dollar value of deals in each pipeline stage to highlight where revenue is accumulating or stalling.
- Deals Closed Over Time – A trend line chart showing monthly closures to track sales momentum.
- Opportunity Detail Table – A sortable table with filters, including opportunity ID, stage, deal amount, close date, and win rate.
- KPI Cards – Highlights include average deal size, average time to close, total pipeline volume, and current top-performing rep.
Interactive slicers (rep, stage, and date range) allow dynamic filtering across all visuals, giving users the flexibility to focus on specific team members or time frames. This page complements Page 1’s high-level overview by drilling into sales execution, efficiency, and conversion insights.